What is BI?
More and more people are deciding to analyse data with BI, and there’s a good reason for it. Business Intelligence, commonly known as BI, is software that is designed to visualise your data in ways that help you understand and gain deeper insights about your business. This typically consists of bringing data from your numerous software packages – such as accounting, ERP, projects and CRM – and consolidating all of this into dashboard-style reports.
You’re able to use filters and other options that dynamically change the content and format of the information you’re viewing. This means you can interrogate your business on the fly. Designed correctly, BI can help you drive your organisation forward. It can do this because it unlocks the value of your data contained within all of your systems.

So, how exactly can you analyse data with BI?
Companies use BI for lots of purposes. Many software applications have their own reporting and analytical tools. However, these tend to have fixed format and style. They also nearly always only show the data contained within that single software application. BI takes this concept to a different level:
- BI is about being able to analyse business information. Companies use this tool to “play” with their data, creating “what if” scenarios. For example, companies might use a map on BI to show sales geographically, and then filter this to view sales by profitability, product types, volume, and even customer industry sector. In doing this, managers are able to visualise the strengths and weaknesses in the performance of their business. You’ll be able to develop opportunities and resolve challenges that are hidden without the use of BI.
- You can use BI to understand activity levels and other proactive outputs across the business. Managers are able to maximise revenue returns by understanding where to focus sales resources. Understanding utilisation of field engineers, technicians, and service delivery personnel can help a company to operate in a more cost-efficient and effective way.
- Viewing business information across time within BI helps companies to spot trends, meaning they can act upon changes and exploit business opportunities in advance that would otherwise be unknown. Knowing trends of how your customers are using your services enables you to predict how you serve them in the future.
- Many companies use BI to consolidate business information from many software applications. For example, a company may have numerous CRM systems, each serving different divisions and functions in their business, but require the ability to create global reporting. Likewise, some companies operate multiple ERP systems and need to be able to join this information, as typically, their customers may use multiple services.
Why choose to analyse your data with Power BI?
Power BI is a Microsoft product and is recognised as a leader in the analytics and business intelligence arena. It’s a great option when looking to analyse data with BI.
It’s easy to attain and implement a Power BI solution:
- You can add Power BI to your company’s Office 365 subscription for a low cost per user per month. You can also choose different licence types depending on what each user needs to use Power BI for.
- Delivering Power BI to the users is cloud-based, which generally means buying computer hardware is not required.
- Creating workspaces (dashboards and reports etc.) is straight forward and modifying these is easy. Knowledge of the source data is required and a basic understanding of how data is joined together is useful.
- Using Power BI requires little to zero training. Provided the user understands the business information presented, learning the tools and features of Power BI is a simple journey.
- It only takes a handful of days to design, build and deliver a Power BI solution. You can also add other business applications on demand at any time. This means you could build your Power BI platform in agile stages and at a pace that is best for your business.

Implementing Power BI with the help of a Technology Partner
There are some technical aspects when building a Power BI solution. Many companies do not have the necessary in-house skill sets. A Technology Partner brings these skills to the project. This tends to be in the areas of extracting data from software systems and getting this data ready for consumption within Power BI. At Avrion, we take this further. We help our customers to translate their ideas into properly scoped requirements. Then we build the solution as ready to use. We do this in a collaborative way so that our customers are able to evolve and develop their solution easily.
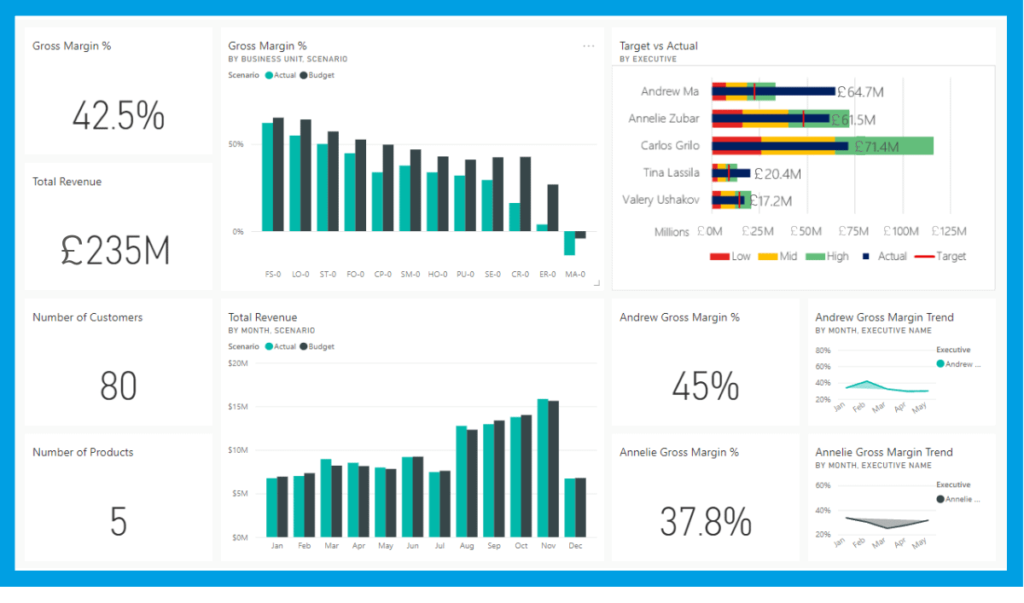
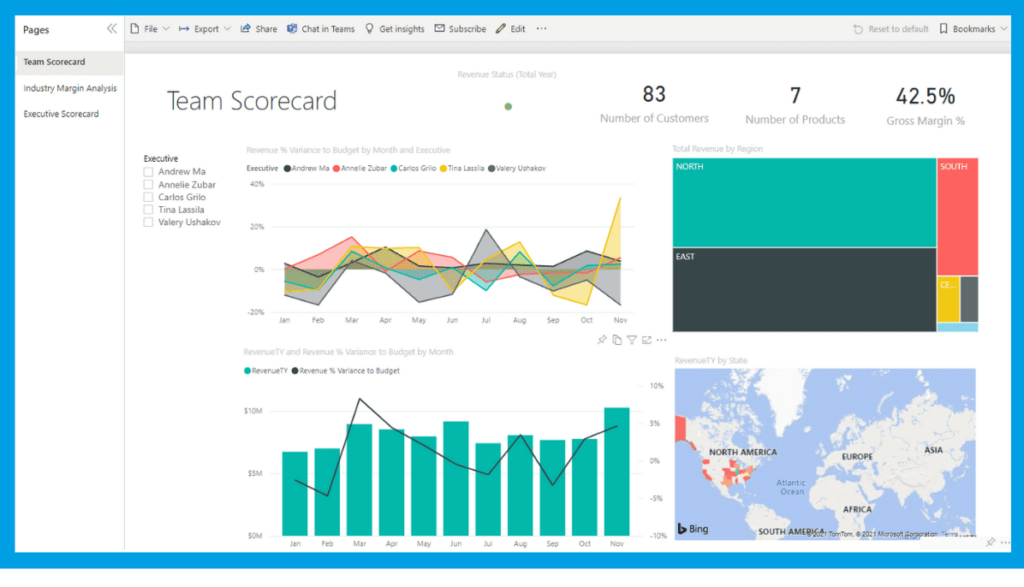
What does Power BI look like?
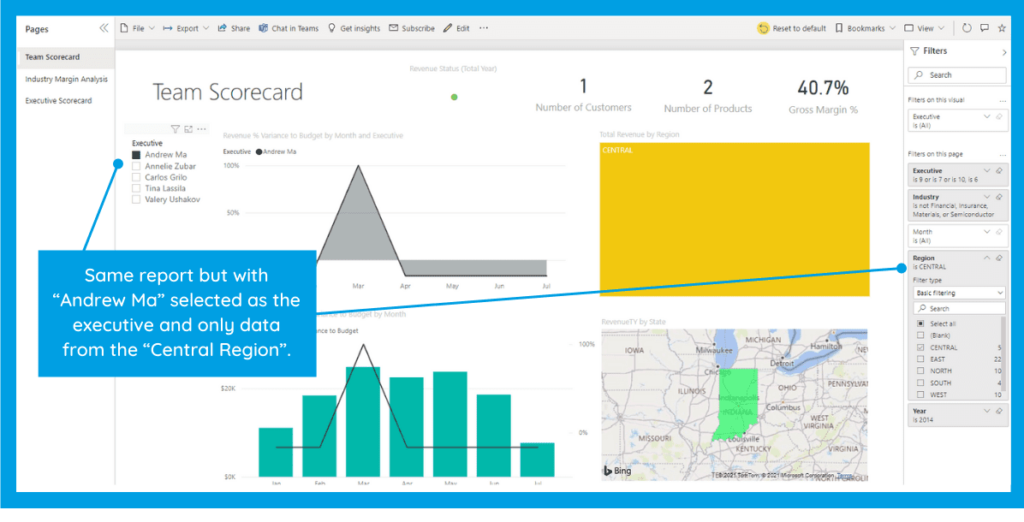
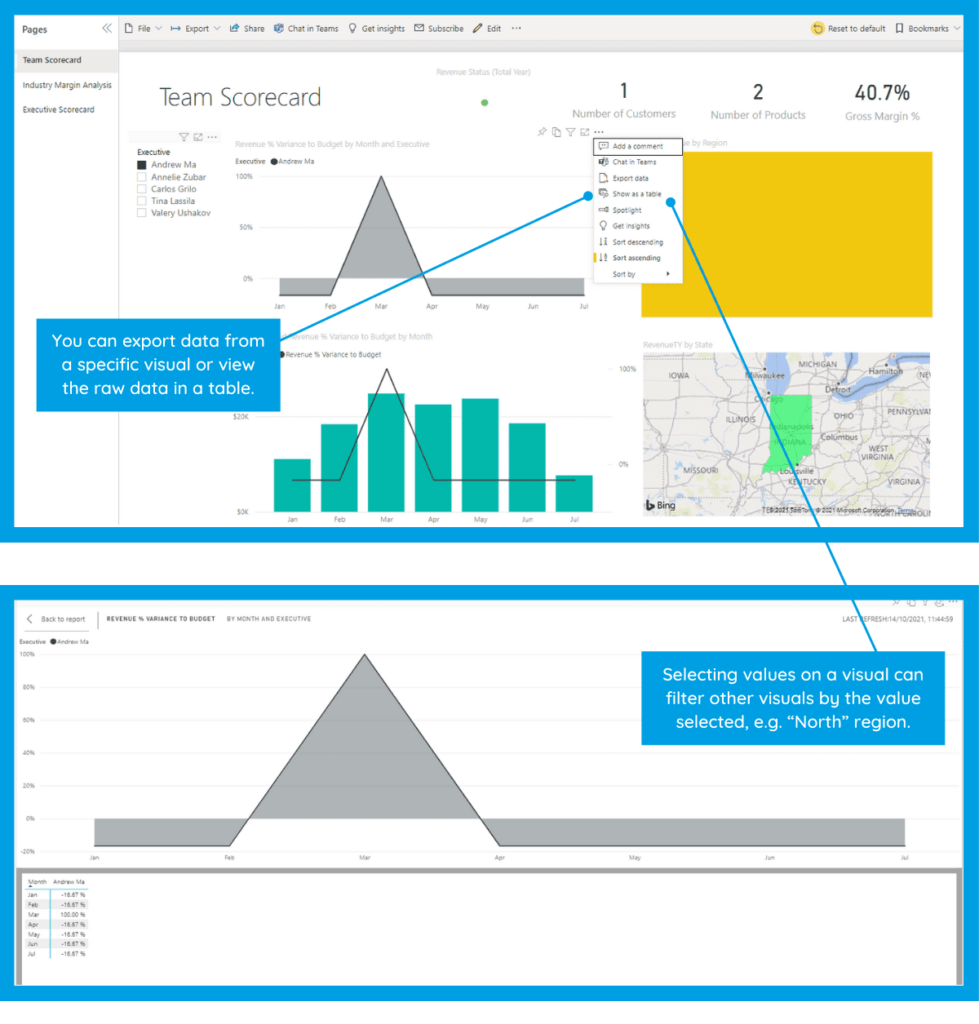
Here are some examples illustrating what a Power BI dashboard (workspace) could look like:
Further information on how to analyse data with BI
If you’d like to analyse data with BI or discover the value Microsoft Power BI can bring to your business. Start your journey now – get in touch.


